By StefaniaSpezzati, Donal Griffin, and Viren VaghelaNovember 28, 2019, 10:36 AM CST Updated on November 29, 2019, 2:35 AM CST
Morgan Stanley fired or placed on leave at least four traders over an alleged mismarking of securities that concealed losses of between $100 million and $140 million, according to people with knowledge of the matter.
The firm is investigating the suspected mismarking, which was linked to emerging-market currencies, said the people, who asked not to be identified as the details are private. Tom Walton, a spokesman for the New York-based bank, declined to comment.
The traders who have been identified as part of the probe include Scott Eisner and Rodrigo Jolig, both based in London, and two senior New York-based colleagues, Thiago Melzer and Mitchell Nadel, the people said. Eisner, Jolig, Melzer and Nadel didn’t respond to requests for comment. Their ultimate employment status isn’t yet clear, but at least some of them are leaving the bank, the people said.
Melzer was given responsibility for foreign exchange and emerging-markets Americas trading in March, while Nadel runs macro trading in the Americas, including rates and currencies. Eisner was managing orders for the Central and Eastern Europe, Middle East and Africa currency book, known as CEEMEA, according to his LinkedIn profile.
In so-called mismarking, the value placed on securities doesn’t reflect their actual worth. The scope of the probe at Morgan Stanley includes currency options that give buyers the right to trade at a set price in the future, enabling them to both speculate and hedge against potential losses. Dealing in foreign-exchange options surged 16% to $294 billion per day in April, according to the most recent data from the Bank for International Settlements.
Morgan Stanley’s currency options desk has struggled this year amid a slump in the volatility that generates profits for traders, even in the more unruly emerging markets, according to a person with knowledge of the performance. The JPMorgan Global FX volatility index trades at the lowest since the summer of 2014.
Third Quarter
The Wall Street firm booked some of the losses in the third quarter, one of the people said. Morgan Stanley reported a 21% increase in overall fixed-income trading revenue, a result that was “partially offset by a decline in foreign exchange,” according to its third-quarter earnings presentation.
The probe shows “the amount of effort still needed in these large organizations to reduce episodes of misconduct,” said Angela Gallo, a finance lecturer at Cass Business School. “The frequency of misconduct cases in the U.S. and Europe in recent years speaks very loudly that more fundamental changes are required.”
It has been a turbulent week for securities firms in London and New York after Citigroup Inc. was fined 44 million pounds ($57 million) by the Bank of England for years of inaccurate reporting to regulators about the lender’s capital and liquidity levels. The incidents point to weak internal controls at investment banks a decade on since the financial crisis.
Natixis SA, the French lender roiled by risk-management problems since last year, has suspended a senior trader at a subsidiary in New York pending an internal investigation, Bloomberg News reported this week.
Officials at the French bank are reviewing issues around how some of the senior trader’s transactions have been recorded, the people said. The bank is also examining how he managed his portfolio of trades, they said, requesting anonymity as the details aren’t public.
— With assistance by Silla Brush(Updates with additional details in final paragraph.)
Tad Rivelle, Chief Investment Officer of the Californian bond house TCW, doubts that the Central Banks can prevent the impending economic downturn. He spots increasing signs of stress in the credit sector and recommends holding safe assets to be prepared for turmoil in the financial markets.
Mr. Rivelle, who rarely gives interviews, views the prospects on the financial markets with skepticism. In his opinion, it’s clear that the business cycle is in its final stages. He warns that the power of unconventional monetary policy is largely exhausted and nervousness in the credit sector is growing.
Against this background, he advises a defensive calibration of the portfolio and a careful approach when it comes to security selection – especially in the investment grade segment where many companies are more leveraged than their rating indicates.
Mr. Rivelle, the rally in stocks has lost some of its momentum recently. Nevertheless, the S&P 500 is near its all-time high. What’s your take on the current market environment?
We’re very skeptical of taking risks in this market since there is fairly abundant evidence that we’re in a late cycle type of environment. Equity valuations are largely following the script of the central banks: The central banks say dance, and the equity market is dancing. In contrast, debt investors increasingly say: «There is nothing in it for me to get on the dance floor because as a debt investor, all I get back is a 100 cents on the dollar». We’re the asset class that’s always at risk of loss. The Federal Reserve can say and do whatever it wants. But if it can’t get the private sector to follow through with cheap financing and debt markets become skeptical of providing favorable financing, I don’t know where you go with that.
Globally, there’s around $ 12 trillion in negative yielding debt. How do you approach such a market as a veteran fixed income investor?
It’s an absurdity and an artificial condition. For instance, a Swiss company like Nestlé finds itself in some kind of financial paradox: They can issue negative yielding debt in Swiss francs and then use the proceeds to buy back their own equity. If you want to reflect on this philosophically: Why have any equity at all? You could just buy it all back. That leads to the next observation: Your assets theoretically are producing benefits and your liabilities are producing benefits, too. This would imply there’s no cost running your business at all. This is obviously a hint that markets didn’t get to negative interest rates through a negotiation process between borrowers and lenders. Rates were pushed off the cliff by the central banks.
What are the consequences of these artificially low interest rates?
The collective and extraordinary expansion of central bank balance sheets has powered the «bull market in everything». But these absurd policies aren’t going to work for the long term. In this cycle, the Zeitgeist has been that the central banks have the capacity to maintain growth and prosperity. In others words: If you control the financing right to corporations and consumers, you can make the economy grow forever. This flies in the face of common sense. Economics used to always be about the idea that you need to incentivize producers to make efficient choices. If you give them the right incentives, they will raise the bar in terms of value addition and growth over time. But when you artificially chose your rates, you are doing the opposite. You’re causing bad choices by definition.
Where are such bad choices evident today?
The low rate environment has created excesses in a lot of areas. It has driven up asset prices, and as you drive up enterprise multiples, you drive up leverage multiples. Look at private equity: The best idea that most institutional investors say is in their portfolio is private equity. That’s strange since the whole concept of private equity is basically that you buy up businesses, you put a lot of leverage underneath them, you don’t mark things to market – at least not the same way as the public markets do – and you create this illusion of low volatility investments. So you have a system where company managers get enabled to say ridiculous things to their investors like: «We don’t care about profits». I don’t think we would have a company like WeWork if we didn’t have an environment where investors are thinking that they need to invest in a fairy tale because they can’t earn a return any other way.
What’s your take the WeWork disaster?
WeWork was one of these situations hiding in plain sight. There were plenty of people who expressed skepticism. Yet, you had money center banks playing along, making loans and adding to the credibility of it. So you had a fairy tale: You had a $47 billion unicorn two or three months ago that now had to be rescued. I’ll go further: If SoftBank didn’t rescue WeWork, would you really want to find out what the lawsuits are going to discover when the Limited Partners sue SoftBank? When they ask: «How did we get to $47 billion, exactly?» And while you’re at it, you might be even doing that in a court in Riyadh. So maybe this point, the best course of action is just to pay everybody off and then figure out what to do.
Where are other disasters hiding in plain sight?
When you get to the last phase of the cycle, you need to be thinking about what could go wrong, because there is very little probably that’s going to go right. Today, a lot of carnage has come to the fracking area. There are a lot of E&P capital structures that are evidently no longer financeable in the capital market. A lot of these businesses are probably going into bankruptcy. Also, you see stress in automotives, in semiconductors and in retail. What’s more, it’s fair to say that the bank loan market represents one of the significant risks out there.
What are red flags investors should watch out for?
The number of high yield credits trading at spreads over a thousand basis points over treasuries has been rising all year long. Also, you’re seeing a lot more volatility in the leveraged lending space. Credit Investors increasingly are firing first, and ask questions later. This speaks back to another of the excesses in this cycle. Traditionally, the deal was that if you are a leveraged company, you were given two choices in the debt markets: Door number one, you can show the world what your financials are, adhere to the public standards, issue high yield bonds and report to the SEC and your debt investors what’s going on. Door number two: If you don’t want to show your numbers you had to get your hands tied behind your back. The lenders will give you the money but they won’t let you do much of anything with it because they want to make sure you’re not doing something stupid while they can’t watch you.
And what’s going on in this cycle?
This cycle, we have moved to an environment where what was a covenant heavy bank loan market has become a covenant light bank loan market. As a debt investor, you don’t have transparency and you have no ability to constructively restrict what management is doing. Private equity plays into this dynamic because it has used its market power to negotiate on behalf of its portfolio companies. So we’ve seen a worsening of covenants and credit agreements. Some of this relates back to a basic dynamic that the Fed and other central banks have put their hand on the scale: They’re basically communicating that they want to make it so easy for borrowers that lenders are saying: «Cash is burning a hole in my pocket. I need to do something with it.»
How does this end?
This is how it all ends badly. Think about the DNA of markets. Let’s say, you want to buy a house. In a red-hot market, you show up at the first day and there’s twenty people looking to buy. You want to do your due diligence and ask about the foundation, the roof and maybe the crazy neighbor. Finally, you get hold of the seller and he’s like: «I don’t have time. I’m not answering your questions. The only thing I want to hear from you is how much over the full offer price you want to pay.» That’s the way the credit markets were in 2017. «Drive-by» deals were done and investors like ourselves got the call in the morning saying: «Company XYZ is raising $ 500 million, you’re in or you’re out?» So no time for due diligence.
That doesn’t sound like prudent behavior.
Now, fast forward a couple of years and suppose you’re in a stone-cold housing market. You list your house, you wait three weeks and finally, some barely qualified buyer walks through the door and wants to know about your foundation, your roof and the crazy neighbor. After you’re done answering his questions, he’s got more and more questions because he recognizes intuitively that every time you can’t answer a question, he can make a worse case assumption and use it as justification to knock your price down. So suddenly the market has become completely illiquid and very hostile.
At which stage are we in the credit markets today?
Generally, if you’re involved in a bank loan that doesn’t have the parameters a CLO would naturally buy, the sponsorship is thin. If everything is fine, you probably won’t experience a lot of volatility. But miss your earnings or communicate some bad news and investors drop challenged credits like «hot potatoes.» That’s logical because your business has been operating in the dark. You haven’t told your lenders anything for years. Now, the only news you’re giving them is bad news. So they have to assume that this bad news hasn’t just happened yesterday, but there are deeper ongoing issues. They want out, but there is no bid on the other side. That’s why a liquidity crisis is all but inevitable.
How long until these developments evolve into a bigger issue for the financial markets?
We thought it was going to happen two years ago. Credit markets look late cycle, manufacturing looks pretty late cycle and corporate profitability, as well. So the proliferation of negative rates may also suggest that central bank policy has reached exhaustion. It’s almost like negative rates are the last thing central bankers are trying to make it work.
What are the chances of a recession against this backdrop?
It’s a little hubristic to say we’re going to have a recession in the next twelve months. What’s not hubristic is to say that these policies are not working and we will inevitably have a recession. Didn’t we try this at least once or twice before? Didn’t the Soviet Union have zero percent interest rates? Didn’t they have recessions? Maybe it wasn’t visible in the official statistics, but their recessions were manifested by longer lines at food stores.
What have zero percent or negative interest rates to do with that?
Artificial asset prices distort resource allocation and growth. Look at the fact that Sears and Kmart are for all intents and purposes just about to disappear on the scrap yard of history. All the resources invested in stores, labor and capital, are worthless. So the faster you get rid of it, presumably the better off you’re ultimately going to be. Recessions are not optional, they are inevitable. It’s the process in which it’s all getting washed out and rearranged. It’s like: «Don’t you want to get to the passing lane eventually? Or do you want to be stuck in the right line because you’re afraid of change?» Eventually you have to do it anyway.
An important piece of the puzzle is the US consumer. How healthy are households in the United States financially?
The US consumer is divided: You have the middle- and upper-class consumer, which seems to be in fine shape at the moment. You wouldn’t expect differently because consumer proclivity to buy is a function of income, employment and housing prices. So middle class people in general feel more secure with employment as high as today and their house worth 20% more versus what it was ten years ago. On the other hand, the subprime consumer is more credit dependent and metrics there are not really good. We’re seeing deterioration in delinquency rates and charge-offs for the lower range of credit counterparties. The problem is, that this is where a lot of growth ultimately comes from, from the marginal buyer.
What does it mean in terms of Fed policy? Are more rate cuts coming down the road?
Receive a daily recap featuring a curated list of must-read stories.
Let me be maximally charitably to the Fed: They have no backing by elected officials from either party to do anything but lower rates in response to incremental economic weakness. So it’s fair to say that if the economy weakens they will lower rates more, regardless of what they say. It won’t happen this year, I presume. But I guess in 2020 they’re going to cut rates again. We invented central banks because we figured out that the banking system, if left to its own faith, is too volatile and that we need a state sponsored institution to cushion the blow. But somehow, we went from there to the Fed buying $ 60 billion of T-Bills a month, calling it not Quantitative Easing, and central banks in Europe and Japan imposing negative rates.
What’s the yield on the ten-year treasury going to be in a year from now?
I would say somewhere around where it is today, between 1.5 and 2%. But that’s just a wild guess. It’s a question of timing and causation: If this becomes a global led downturn you have to assume that US rates are going lower. But you can also imagine other scenarios. US rates being above overseas rates has brought huge capital inflows and people are getting very used to the idea that these capital inflows will always hold down US rates. But what’s going to happen when these flows reverse for who knows what reasons and US rates go up?
What should a prudent investor do under these circumstances?
You should adapt your underwriting standards to the kind of environment that you are in. So, beginning a couple of years ago, we adopted our underwriting standards to be much more careful with respect to the types of risks we’re taking throughout our whole portfolio. In other words: Stay vigilant, focus on staying liquid, focus on safe assets and wait for volatility to present opportunity.
So how does a robust bond portfolio look?
It was Benjamin Graham pointing out that bond selection is a negative art. That’s especially true in the late cycle. Cycles die in large measure because capital gets tied up in unprofitable enterprises. So you need to think long and hard about what claims are breakable and can suffer catastrophic and permanent price declines. There may be a time to own breakable assets, but after they break and not before.
What are such breakable assets today?
There will be plenty of breakable assets and a lot of them will be in the high yield and bank loan market. Some maybe even in the investment grade market. Today, 11% of investment grade issuers are levered more than five times, an 27% are levered more than four times. In this context, you could make a pretty good case that 50% of BBB debt would have a high-yield rating based on leverage alone.
Where are better places to invest?
We’re counselling to divide your assets between bendable assets and riskless assets for the liquidity issues that we’re going to encounter. I would put treasuries and agency mortgages as the risk-off, liquid part of the portfolio. You can’t retire on them or really do anything with it. But you can own them tactically to finance the expansion of your bendable assets: Assets that are exposed to mark-to-market risk, meaning they go up and down, so they may be exposed to liquidity risks. But they provide you yield today and their claims will survive into the next cycle, if you have done your categorization right.
What are attractive bendable assets?
Bendable is what we refer to as true investment grade credit. Also, AAA-rated commercial mortgage-backed and asset-backed securities as well as senior non-agency residential mortgage-backed securities. Stuff that we’re invested in obviously. In some cases, AAA-rated CLO tranches can potentially make some sense, too. And, if you can find them, some high yield securities maybe, or a few emerging market securities. You try to find companies with a wide enough moat around what they’re doing, like regulated utilities as long as they’re not in California where you have a special environment with damage claims from wildfires.
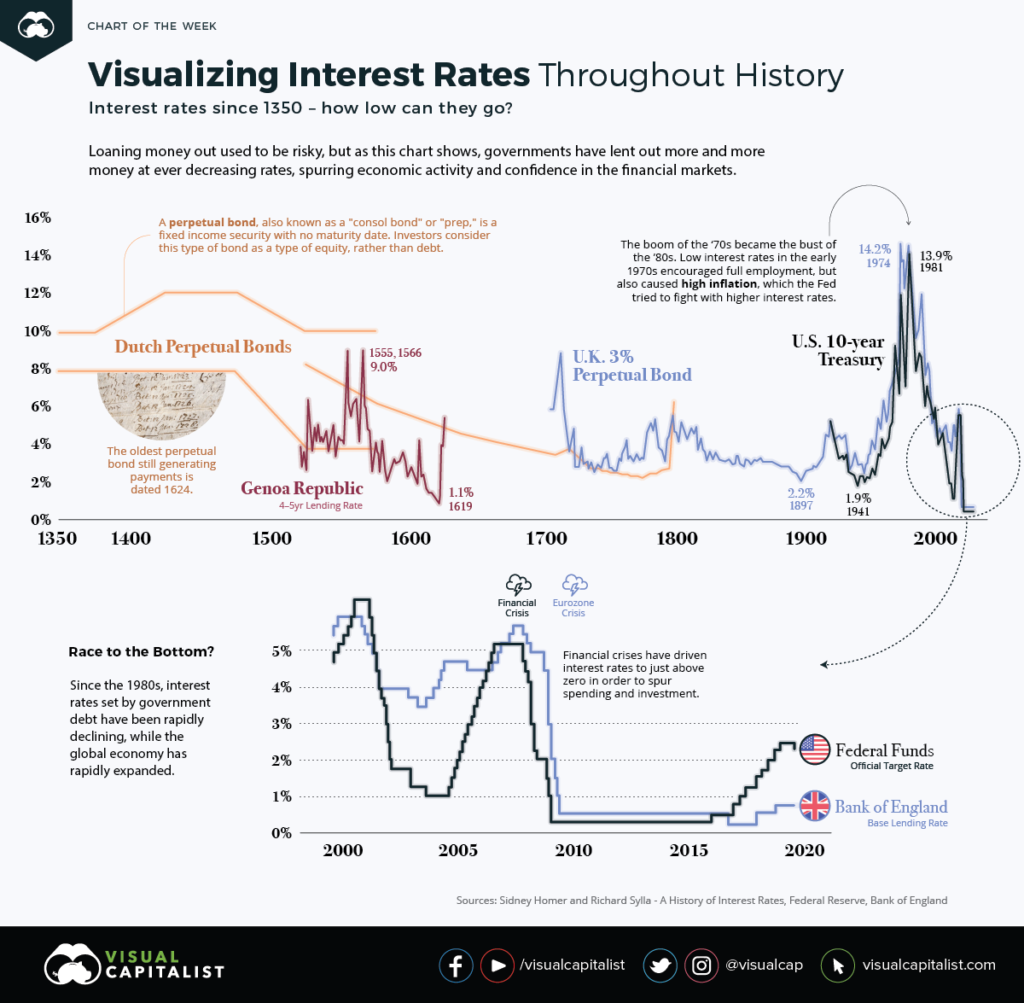
Today, we live in a low-interest-rate environment, where the cost of borrowing for governments and institutions is lower than the historical average. It is easy to see that interest rates are at generational lows, but, as Visual Capitalist’s Nicholas LePan notes below, did you know that they are also at 670-year lows?
This week’s chart outlines the interest rates attached to loans dating back to the 1350s. Take a look at the diminishing history of the cost of debt—money has never been cheaper for governments to borrow than it is today.
Courtesy of Visual Capitalist
The Birth of an Investing Class
Trade brought many good ideas to Europe, while helping spur the Renaissance and the development of the money economy.
Key European ports and trading nations, such as the Republic of Genoa or the Netherlands during the Renaissance period, help provide a good indication of the cost of borrowing in the early history of interest rates.
The Republic of Genoa: 4-5 year Lending Rate
Genoa became a junior associate of the Spanish Empire, with Genovese bankers financing many of the Spanish crown’s foreign endeavors.
Genovese bankers provided the Spanish royal family with credit and regular income. The Spanish crown also converted unreliable shipments of New World silver into capital for further ventures through bankers in Genoa.
Dutch Perpetual Bonds
A perpetual bond is a bond with no maturity date. Investors can treat this type of bond as an equity, not as debt. Issuers pay a coupon on perpetual bonds forever, and do not have to redeem the principal—much like the dividend from a blue-chip company.
By 1640, there was so much confidence in Holland’s public debt, that it made the refinancing of outstanding debt with a much lower interest rate of 5% possible.
Dutch provincial and municipal borrowers issued three types of debt:
Promissory notes (Obligatiën): Short-term debt, in the form of bearer bonds, that was readily negotiable
Redeemable bonds (Losrenten): Paid an annual interest to the holder, whose name appeared in a public-debt ledger until the loan was paid off
Life annuities (Lijfrenten): Paid interest during the life of the buyer, where death cancels the principal
Unlike other countries where private bankers issued public debt, Holland dealt directly with prospective bondholders. They issued many bonds of small coupons that attracted small savers, like craftsmen and often women.
Rule Britannia: British Consols
In 1752, the British government converted all its outstanding debt into one bond, the Consolidated 3.5% Annuities, in order to reduce the interest rate it paid. Five years later, the annual interest rate on the stock dropped to 3%, adjusting the stock as Consolidated 3% Annuities.
The coupon rate remained at 3% until 1888, when the finance minister converted the Consolidated 3% Annuities, along with Reduced 3% Annuities (1752) and New 3% Annuities (1855), into a new bond─the 2.75% Consolidated Stock. The interest rate was further reduced to 2.5% in 1903.
Interest rates briefly went back up in 1927 when Winston Churchill issued a new government stock, the 4% Consols, as a partial refinancing of WWI war bonds.
American Ascendancy: The U.S. Treasury Notes
Receive a daily recap featuring a curated list of must-read stories.
The United States Congress passed an act in 1870 authorizing three separate consol issues with redemption privileges after 10, 15, and 30 years. This was the beginning of what became known as Treasury Bills, the modern benchmark for interest rates.
The Great Inflation of the 1970s
In the 1970s, the global stock market was a mess. Over an 18-month period, the market lost 40% of its value. For close to a decade, few people wanted to invest in public markets. Economic growth was weak, resulting in double-digit unemployment rates.
The low interest policies of the Federal Reserve in the early ‘70s encouraged full employment, but also caused high inflation. Under new leadership, the central bank would later reverse its policies, raising interest rates to 20% in an effort to reset capitalism and encourage investment.
Looking Forward: Cheap Money
Since then, interest rates set by government debt have been rapidly declining, while the global economy has rapidly expanded. Further, financial crises have driven interest rates to just above zero in order to spur spending and investment.
It is clear that the arc of lending bends towards ever-decreasing interest rates, but how low can they go?
Pessimism is spreading like wildfire on Wall Street, and this is particularly true among one very important group of investors. And considering how much money they have, it may be wise to listen to what they are telling us. According to a very alarming survey that was recently conducted by UBS Wealth Management, most wealthy investors now believe that there will be a “significant” stock market decline before the end of next year. The following comes from Yahoo Finance…
Wealthy people around the globe are hunkering down for a potentially turbulent 2020, according to UBS Global Wealth Management.
A majority of rich investors expect a significant drop in markets before the end of next year, and 25% of their average assets are currently in cash, according to a survey of more than 3,400 global respondents. The U.S.-China trade conflict is their top geopolitical concern, while the upcoming American presidential election is seen as another significant threat to portfolios.
Of course this could ultimately become something of a self-fulfilling prophecy if enough wealthy investors pull their money out of stocks and start increasing their cash reserves instead. Nobody wants to be the last one out of the barn, and it isn’t going to take too much of a spark to set off a full-blown panic. Perhaps the most troubling number from the entire survey is the fact that almost 80 percent of the wealthy investors that UBS surveyed believe that “volatility is likely to increase”…
Nearly four-fifths of respondents say volatility is likely to increase, and 55% think there will be a significant market sell-off before the end of 2020, according to the report which was conducted between August and October and polled those with at least $1 million in investable assets. Sixty percent are considering increasing their cash levels further, while 62% plan to increase diversification across asset classes.
During volatile times for the market, stocks tend to go down.
And during extremely volatile times, stocks tend to go down very rapidly.
Could it be possible that many of these wealthy investors have gotten wind of some things that the general public doesn’t know about yet?
Of course the truth is that anyone with half a brain can see that stock valuations are ridiculously bloated right now and that a crash is inevitable at some point.
And as I noted yesterday, corporate insiders are currently selling off stocks at the fastest pace in about two decades.
But why is there suddenly so much concern about 2020?
A majority of respondents – 62% – believe a recession will happen within the next 18 months. Private companies are particularly worried that a recession lurks in the near term, with 39% anticipating a recession in the next 12 months. This compares with 33% of public company respondents who felt the same way. About one-quarter – 23% – of respondents do not expect a recession within the next two years.
62 percent is a very solid majority, and without a doubt we are starting to see businesses pull back on investment in a major way.
In fact, according to Axios business investment in the United States has now dropped for six months in a row…
Business investment has fallen for six months straight and declined by 3% in the third quarter, the largest drop since 2015.
The retrenchment by businesses helped turn Wednesday’s U.S. workforce productivity report — a key economic metric that compares goods-and-services output to the number of labor hours worked — negative for the first time in four years.
I know that I bombard my readers with numbers like this on an almost daily basis, but I cannot stress enough how ominous the economic outlook is at this point.
And it isn’t just the U.S. that we need to be concerned about. Two other surveys that measure the business outlook for the entire globe just fell to their lowest levels in a decade…
The IHS Markit global business outlook—which surveys 12,000 companies three times a year—fell to the worst level since 2009, when data was first collected.
The Ifo world economic outlook, which surveys 1,230 people in 117 countries, fell in the fourth quarter to the worst level since the second quarter of 2009.
Markit’s poll found optimism for activity, employment and profits in the year ahead were all at the lowest level since the financial crisis. Markit also reported a decline in planned investment spending, with inflation expectations at a three-year low.
It is really happening.
The global economy really is heading into a major downturn.
And once this crisis really gets rolling, it is going to be exceedingly painful.
All across America, big companies are already starting to go under at a pace that is absolutely frightening. For instance, on Tuesday one of the biggest dairy companies in the entire country filed for bankruptcy…
Dean Foods – whose more than 50 brands include Dean’s, Land O’ Lakes and Country Fresh – said it intends to continue operating.
The company said it “is engaged in advanced discussions” for a sale to Dairy Farmers of America, a national milk cooperative representing farmers, producers and brands such as Borden cheese and Kemps Dairy.
I have quite a few relatives in Minnesota, and I have always had a soft spot for Land O’Lakes butter. So it definitely saddened me to hear that this was happening.
But a lot more major casualties are coming.
Of course the economic optimists will continue to insist that we are just experiencing a few bumps on a path that leads to a wonderful new era of American prosperity. They will continue to tell us of a great “financial harvest” that is about to happen even when things are falling apart all around us.
You can believe them if you want, but most wealthy investors and most business owners believe that hard times are dead ahead.
I have never seen so much pessimism about a coming year as I am seeing about 2020 right now.
There is a growing national consensus that it is going to be a very chaotic year, and I would recommend using what little time you have left to get prepared for it.
About the Author: I am a voice crying out for change in a society that generally seems content to stay asleep. My name is Michael Snyder and I am the publisher of The Economic Collapse Blog, End Of The American Dream and The Most Important News, and the articles that I publish on those sites are republished on dozens of other prominent websites all over the globe. I have written four books that are available on Amazon.com including The Beginning Of The End, Get Prepared Now, and Living A Life That Really Matters. (#CommissionsEarned) By purchasing those books you help to support my work. I always freely and happily allow others to republish my articles on their own websites, but due to government regulations I need those that republish my articles to include this “About the Author” section with each article. In order to comply with those government regulations, I need to tell you that the controversial opinions in this article are mine alone and do not necessarily reflect the views of the websites where my work is republished. This article may contain opinions on political matters, but it is not intended to promote the candidacy of any particular political candidate. The material contained in this article is for general information purposes only, and readers should consult licensed professionals before making any legal, business, financial or health decisions. Those responding to this article by making comments are solely responsible for their viewpoints, and those viewpoints do not necessarily represent the viewpoints of Michael Snyder or the operators of the websites where my work is republished. I encourage you to follow me on social media on Facebook and Twitter, and any way that you can share these articles with others is a great help.
For the hard-asset enthusiast, the gold-silver ratio is common parlance. For the average investor, it represents an arcane metric that is anything but well-known. The fact is that a substantial profit potential exists in some established strategies that rely on this ratio. The gold-silver ratio represents the number of ounces of silver it takes to buy a single ounce of gold. Here’s how investors benefit from this ratio.
KEY TAKEAWAYS
Investors use the gold-silver ratio to determine the relative value of silver to gold.
Investors who anticipate where the ratio is going to move can make a profit even if the price of the two metals fall or rise.
The gold-silver ratio used to be set by governments for monetary stability, but now fluctuates.
Alternatives to trading the gold-silver ratio include futures, ETFs, options, pool accounts, and bullion.
What Is the Gold-Silver Ratio?
The gold-silver ratio refers to the ratio investors use to determine the relative value of silver to gold. Put simply, it is the quantity of silver in ounces needed to buy a single ounce of gold. Traders can use it to diversify the amount of precious metal they hold in their portfolio.
Here’s how it works. When gold trades at $500 per ounce and silver at $5, traders refer to a gold-silver ratio of 100:1. Similarly, if the price of gold is $1,000 per ounce and silver is trading at $20, the ratio is 50:1. Today, the ratio floats and can swing wildly. That’s because gold and silver are valued daily by market forces, but this has not always been the case. The ratio has been permanently set at different times in history and in different places, by governments seeking monetary stability.
Gold-Silver Ratio History
The gold-silver ratio has fluctuated in modern times and never remains the same. That’s mainly due to the fact that the prices of these precious metals experiences wild swings on a regular, daily basis. But before the 20th century, governments set the ratio as part of their monetary stability policies.
Here’s a quick overview of the history of this ratio:
2007: For the year, the gold-silver ratio averaged 51.
1991: When silver hit record lows, the ratio peaked at 100.
1980: At the time of the last great surge in gold and silver, the ratio stood at 17.
End of the 19th Century: The nearly universal fixed ratio of 15 came to a close with the end of the bi-metallic era.
Roman Empire: The ratio was set at 12.
323 BC: The ratio stood at 12.5 upon the death of Alexander the Great.
Importance of Gold-Silver Ratio
Despite not having a fixed ratio, the gold-silver ratio is still a popular tool for precious metals traders. They can, and still do, use it to hedge their bets in both metals—taking a long position in one, while keeping a short position in the other metal. So when the ratio is higher, and investors believe it will drop along with the price of gold compared to silver, they may decide to buy silver and take a short position in the same amount of gold.
So why is this ratio so important for investors and traders? If they can anticipate where the ratio is going to move, investors can make a profit even if the price of the two metals fall or rise.
Investors can make a profit even if the price of the two metals fall or rise by anticipating where the ratio will move.
How to Trade the Gold-Silver Ratio
Trading the gold-silver ratio is an activity primarily undertaken by hard-asset enthusiasts often called gold bugs. Why? Because the trade is predicated on accumulating greater quantities of metal rather than increasing dollar-value profits. Sound confusing? Let’s look at an example.
The essence of trading the gold-silver ratio is to switch holdings when the ratio swings to historically determined extremes. So:
When a trader possesses one ounce of gold and the ratio rises to an unprecedented 100, the trader would sell their single gold ounce for 100 ounces of silver.
When the ratio then contracted to an opposite historical extreme of 50, for example, the trader would then sell his 100 ounces for two ounces of gold.
In this manner, the trader continues to accumulate quantities of metal seeking extreme ratio numbers to trade and maximize holdings.
Note that no dollar value is considered when making the trade. That’s because the relative value of the metal is considered unimportant.
For those worried about devaluation, deflation, currency replacement, and even war, the strategy makes sense. Precious metals have a proven record of maintaining their value in the face of any contingency that might threaten the worth of a nation’s fiat currency.
Drawbacks of the Trade
The difficulty with the trade is correctly identifying the extreme relative valuations between the metals. If the ratio hits 100 and an investor sells gold for silver, then the ratio continues to expand, hovering for the next five years between 120 and 150. The investor is stuck. A new trading precedent has apparently been set, and to trade back into gold during that period would mean a contraction in the investor’s metal holdings.
In this case, the investor could continue to add to their silver holdings and wait for a contraction in the ratio, but nothing is certain. This is the essential risk for those trading the ratio. This example emphasizes the need to successfully monitor ratio changes over the short- and mid-term to catch the more likely extremes as they emerge.
Gold-Silver Ratio Trading Alternatives
There are a number of ways to execute a gold-silver ratio trading strategy, each of which has its own risks and rewards.
Futures Investing
This involves the simple purchase of either gold or silver contracts at each trading juncture. The advantages and disadvantages of this strategy are the same—leverage. That is, futures trading is a risky proposition for those who are uninitiated. An investor can play futures on margin, but that margin can also bankrupt the investor.
Exchange-Traded Funds (ETFs)
ETFs offer a simpler means of trading the gold-silver ratio. Again, the simple purchase of the appropriate ETF—gold or silver—at trading turns will suffice to execute the strategy. Some investors prefer not to commit to an all or nothing gold-silver trade, keeping open positions in both ETFs and adding to them proportionally. As the ratio rises, they buy silver. As it falls, they buy gold. This keeps the investor from having to speculate on whether extreme ratio levels have actually been reached.
Options Strategies
Options strategies abound for the interested investor, but the most interesting involves a sort of arbitrage. This requires the purchase of puts on gold and calls on silver when the ratio is high and the opposite when the ratio is low. The bet is that the spread will diminish with time in the high-ratio climate and increase in the low-ratio climate. A similar strategy can be applied to futures contracts also. Options permit the investor to put up less cash and still enjoy the benefits of leverage.
The risk here is that the time component of the option may erode any real gains made on the trade. Therefore, it is best to use long-dated options or LEAPS to offset this risk.
Pool Accounts
Pools are large, private holdings of metals that are sold in a variety of denominations to investors. The same strategies employed in ETF investing can be applied here. The advantage of pool accounts is that the actual metal can be attained whenever the investor desires. This is not the case with metal ETFs where certain very large minimums must be held in order to take physical delivery.
Gold and Silver Bullion and Coins
It is not recommended that this trade be executed with physical gold for a number of reasons. These range from liquidity and convenience to security. Just don’t do it.
The Bottom Line
There’s an entire world of investing permutations available to the gold-silver ratio trader. What’s most important is that the investor knows their own trading personality and risk profile. For the hard-asset investor concerned with the ongoing value of their nation’s fiat currency, the gold-silver ratio trade offers the security of knowing, at the very least, that they always possess the metal.
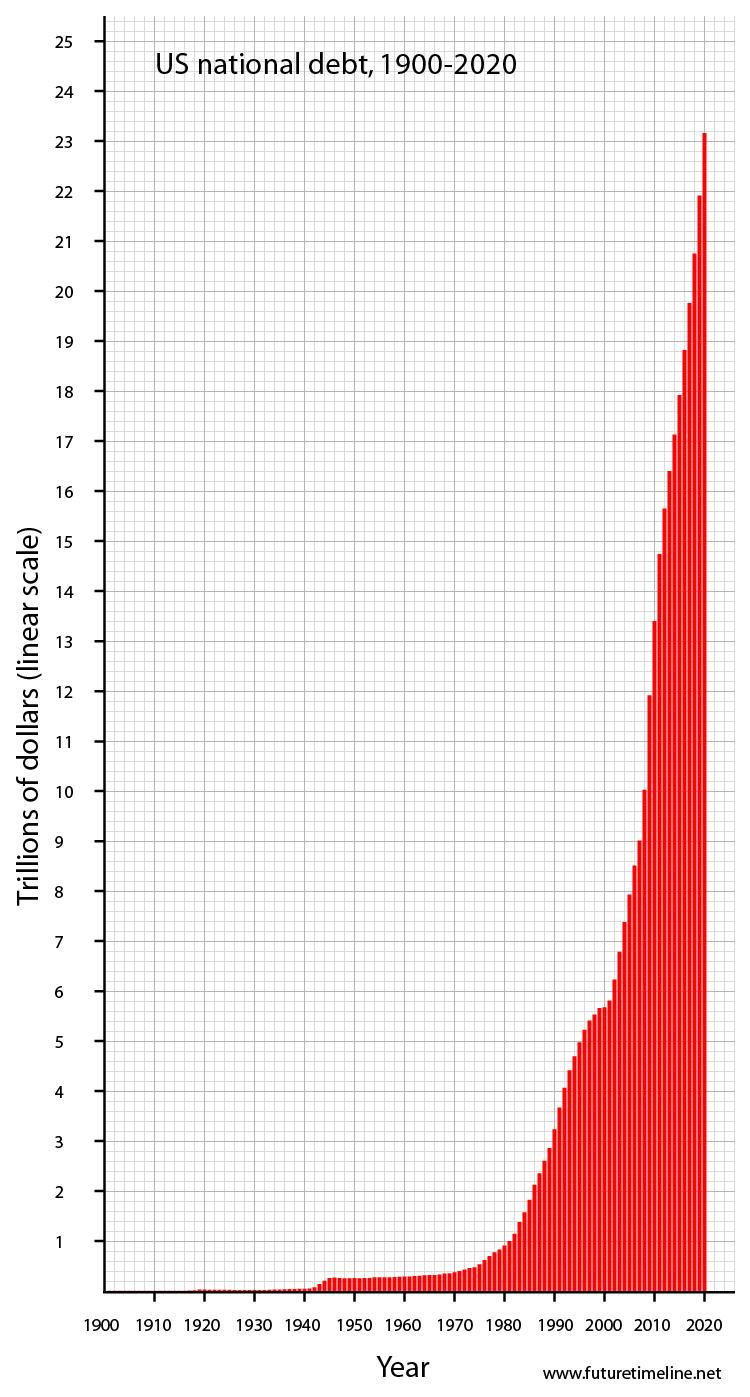
On Oct. 31, the national debt hit $23 trillion. That’s equivalent to a credit card bill of $178,000 for every household in America.
This marks an enormous increase. Even after adjusting for inflation, it’s a jump of $60,000 over just 10 years for the average household.
In other words, even after accounting for inflation, the U.S. added more debt per household over the past 10 years than it did over its first 200 years.
Low interest rates today make our debt seemingly manageable, but the higher America’s debt grows, the more likely it is that rates could suddenly spike, sending terrible shocks throughout the economy.
Now, an obscure pension “fix” could hasten such a shock by opening the door to massive pension bailouts that could push our $23 trillion debt closer to $30 trillion, or $230,000 per household.
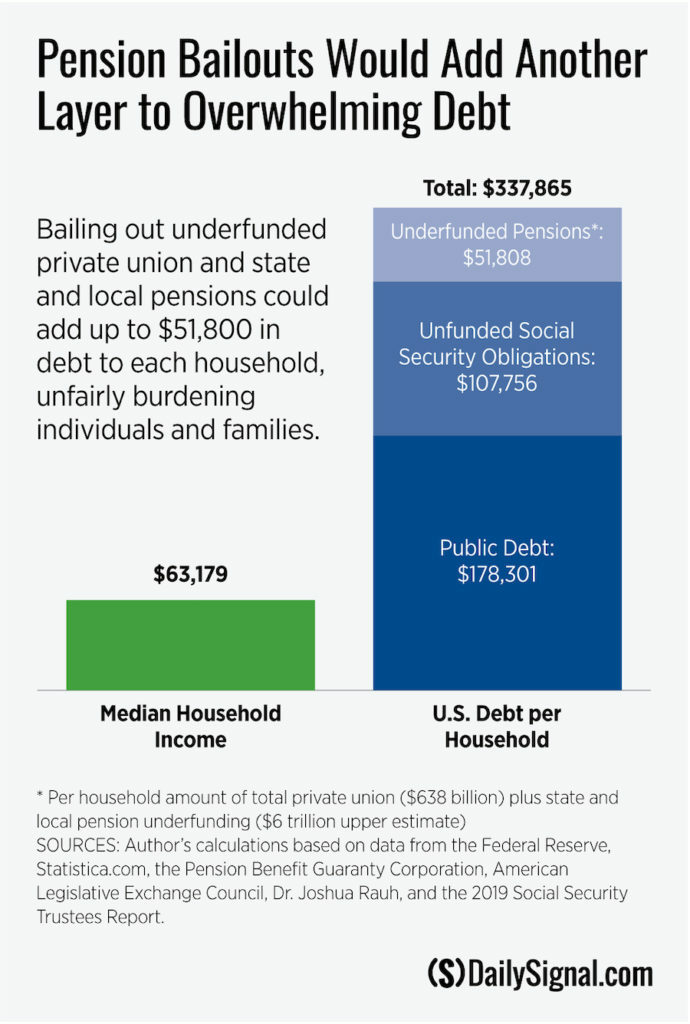
Unbeknownst to most Americans, Congress is considering legislation to “fix” underfunded private union pension plans that have promised at least $638 billion more in pension benefits than they’ve set aside to pay.
The “fix” that mismanaged pension plans have lobbied Congress for is to shift those broken promises onto taxpayers. Politicians who receive hefty donations from unions, along with some lawmakers who have lots of constituents that would benefit from a taxpayer bailout, are pushing for just that—a massive bailout without reform.
Because the proposed bailouts do nothing to penalize plans for their past recklessness and nothing to impose proper funding requirements going forward, those plans’ unfunded obligations would only rise further.
But this time, it would be on the taxpayers’ dime.
Worse, if Congress bails out private union pension plans, how will it say no to teachers, police, and firefighters who come to the federal government asking for a bailout of their state and local pensions that have an estimated $4 trillion to $6 trillion in unfunded pension promises?
Tacking as much as $6.7 trillion onto our national debt to cover broken pension promises would raise the average household’s debt burden by $52,000, to $230,000.
And that would come before Congress tackles Social Security’s $13.9 trillion shortfall that would require an additional $108,000 per household to fix.
All told, the current deficit plus Social Security’s and private and public pension plans’ shortfalls would amount to about $338,000 in debt for the average household.
That’s more than five times the median household’s income.
America’s debt already threatens our freedom and prosperity. Unfairly forcing taxpayers to take on the broken pension promises of private and public sector unions would raise that threat level.
Congress should help alleviate and prevent pension shortfalls—but not through taxpayer bailouts.
First, policymakers must tackle Social Security’s unfunded promises by updating the program and better focusing benefits on those who need them most.
Doing so would prevent massive tax increases—an additional $1,000 to $2,000 per year for middle-class households—on workers.
Congress should then address pension underfunding by maintaining the solvency of its pension insurance program and by enforcing proper funding rules to hold employers and unions liable for the benefits they promise.
The U.S. dollar has been the world’s major reserve currency for decades, but that status could come under threat as “very powerful countries” seek to undermine its importance, warned Anne Korin, from the Institute for the Analysis of Global Security.
Korin says China, Russia and the European Union are some “major movers” behind this push.
One of those reasons driving their shift away from the dollar is the prospect of being subject to U.S. jurisdiction if they transact in dollars.
The U.S. dollar has been the world’s major reserve currency for decades, but that status could come under threat as “very powerful countries” seek to undermine its importance, warned Anne Korin, from the Institute for the Analysis of Global Security.
“Major movers” such as China, Russia and the European Union have a strong “motivation to de-dollarize,” said Korin, co-director at the energy and security think tank, on Wednesday.
“We don’t know what’s going to come next, but what we do know is that the current situation is unsustainable,” Korin said. “You have a growing club of countries — very powerful countries.”
To be sure, the dollar is seen as one of the safest investments in the world, and it rises during times of economic or political tumult.
But one factor curbing countries’ enthusiasm for the greenback is the prospect of being subject to U.S. jurisdiction when they transact in dollars. When the U.S. dollar is used or transactions are cleared through an American bank, entities are subject to U.S. jurisdiction — even if they have “nothing to do with the U.S.,” Korin told CNBC’s “Squawk Box.”
Korin cited Washington’s unilateral withdrawal from the Iran nuclear deal in 2018, which was followed by the restoration of sanctions on Tehran. That situation left European multinational companies vulnerable to punishment from Washington if they continued to do business with Iran.
“Europe wants to do business with Iran. It doesn’t want to be subject to U.S. law for doing business with Iran, right?” she said. “Nobody wants to be picked up at an airport for doing business with countries that the U.S. isn’t happy that they’re doing business with.”
As a result, countries have a “very, very strong motivation” to shift away from using the greenback, she said.
‘Petro-yuan’ may be an early warning
But if the dollar declines in influence, other currencies could fill the role traditionally played by the greenback — especially China’s yuan.
In recent years, China has tried to internationalize the use of its currency, the Chinese yuan. Such moves have included the introduction of yuan-denominated crude oil futures and reports that China is preparing to pay for imported crude in its own currency rather than the U.S. dollar.
Yuan-denominated oil futures — also referred to as “petro-yuan” — could serve as an early warning sign for the dollar’s waning dominance, Korin said.
“I think it’s a canary in the coalmine. Look, 90% of … oil is traded in dollars,” she said. “If you have a sort of a beginning to crumble away (at) the dominance of the dollar over oil trade, that’s a nudge in the direction of de-dollarization.”
However, she added that while the petro-yuan may be a “necessary” condition for the international abandonment of the dollar, it’s “not sufficient” to make it happen on its own.
Coutesy of CNBC by Eutance Huang
PUBLISHED WED, OCT 30 20197:27 PM EDT UPDATED THU, OCT 31 20191:35 AM EDT
With our national debt blowing past 23 trillion dollars nothing is as sobering as looking at future budgets. We should be worried. Central banks across the world claim the lack of inflation is the key force driving their QE policy and permitting it to continue, however, the moment inflation begins to take root much of their flexibility will be lost. This translates into governments being forced to pay higher interest rates on their debt. For years the argument that “This Time Is Different” has flourished but history shows that periods of rapid credit expansion always end the same way and that is in default. This also underlines the reality that any claims Washington makes about the budget deficit being under control is a total lie.
America is not alone in spending far more than it takes in and running a deficit. This does not make it right or mean that it is sustainable. Much of our so-called economic growth is the result of government spending feeding into the GDP. This has created a false economic script and like a Ponzi scheme, it has a deep relationship to fraud.
Global debt has surged since 2008, to levels that should frighten any sane investor because debt has always had consequences. Much of the massive debt load hanging above our heads in 2008 has not gone away it has merely been transferred to the public sector where those in charge of such things feel it is more benign. A series of off-book and backdoor transactions by those in charge has transferred the burden of loss from the banks onto the shoulders of the people, however, shifting the liability from one sector to another does not alleviate the problem.
When the 2018 financial year budget was first unveiled it was projected to be $440 billion. An under-reported and unnoticed later report painted a far bleaker picture. The report titled the“Mid-Session Review”
forecast the deficit much higher than originally predicted. The newer report predicted the deficit would come in at $890 billion which is more than double what they predicted in March of 2017.
Such a miss would bring up the question of whether the discrepancy in the 2018 budget is an outlier or a sign of incompetence. This is especially troubling because what was projected as a total budget deficit of $526 billion for 2019 Fiscal Year has now been revised to a staggering $1.085 trillion. Not only should the sheer size of these numbers trouble us but we should remember that until recently some Washington optimists were forecasting that deficits would begin to decline in 2020 and that we would even have a small surplus of 16 billion in 2026. The updated revisions have washed away this glimmer of hope and replaced it with more trillion-dollar deficits going forward.
Interestingly, the summery that begins on page one of the Mid-Session Review comes across as a promotional piece using terms like MAGAnomicics that praise and tout the Trump administration for its vision and great work. This is a time when it would be wise to remember numbers don’t lie but the people using them do. This report is an example of how they re-frame a colossal train wreck into something more palatable. The report even goes so far as to assure us that the deficit will fall to 1.4 percent of the GDP in 2028, from its current 4.4 percent.As a result of the American economy having survived with little effect what was years ago described as a financial cliff we have become emboldened and now enjoy a false sense of security. Today instead of dire warning we hear news from Washington and the media how the stock market continues to push into new territory and all is well.
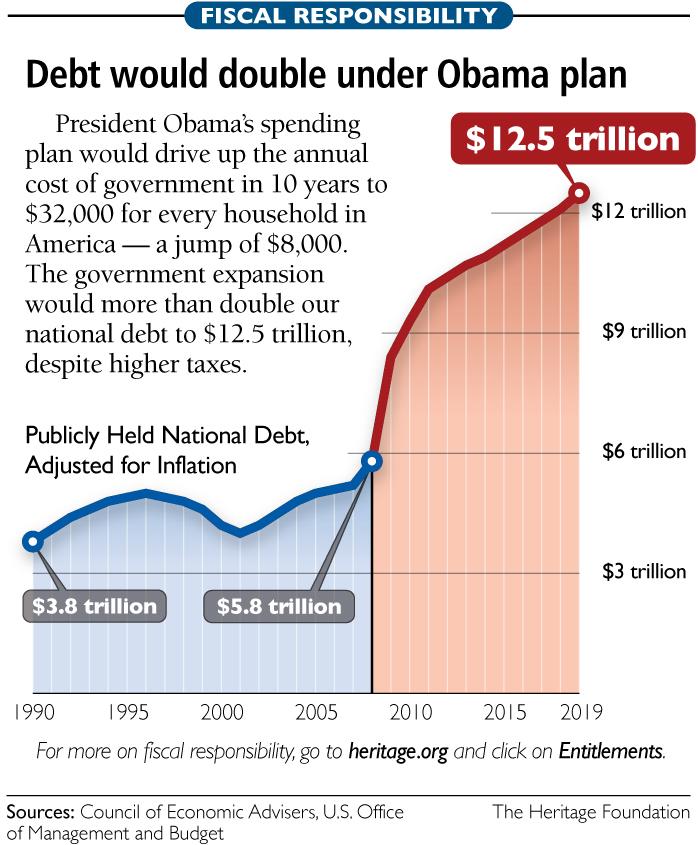
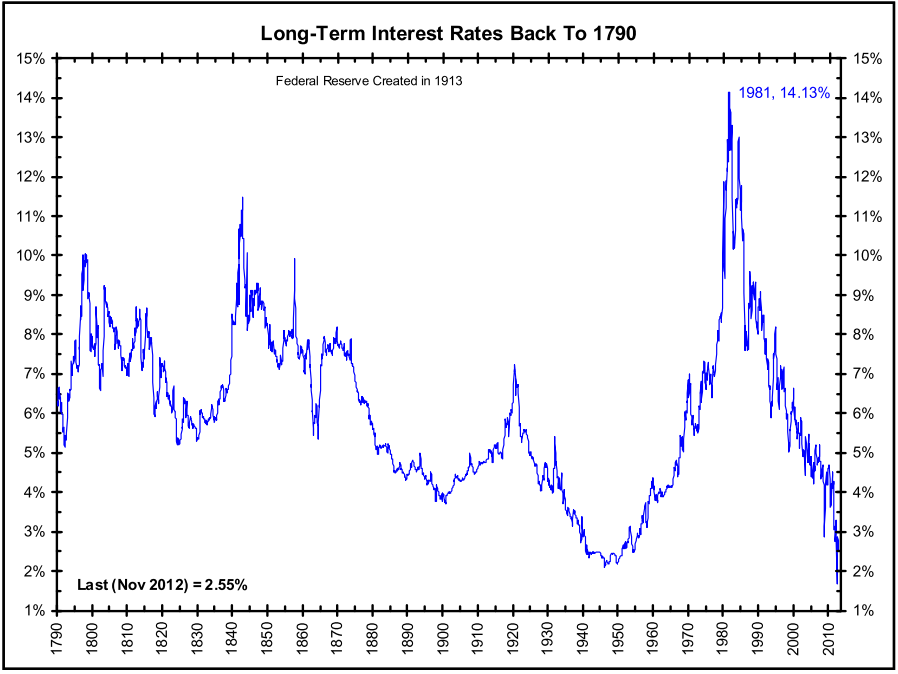
The chart to the right predicted that by 2019 the national debt would top 12 trillion dollars, not the current 23 trillion. Projections made by the government or any group predicting budgets based on events that may or may not happen at some future date are simply predictions and not fact. This means that such numbers are totally unreliable. The ugly truth many people ignore is that starting last year entitlements became the driving force that will carry the deficit higher and higher into nosebleed territory. Even though we have seen deficits reach unprecedented levels the deficits in our future will be dramatically worse.
It isvery disturbing that so many people have forgotten or never taken the time to learn recent financial history. By recent, I’m referring to the last fifty to one hundred years. The path that Fed Chairman Paul Volcker set right decades ago has again become unsustainable and many people will be shocked when this reality hits. Do not underestimate the value of insight gained from decades of economic perspective. It tells us the economy of today is far different from the way things have always been.
Back in September of 2012, I wrote an article reflecting on how the economy of today had been greatly shaped by the actions that took place starting around 1979. Interest rates, inflation, and debt do matter and are more significant than most people realize. Rewarding savers and placing a value on the allocation of financial assets is important. It should be noted that many Americans living today were not even born or too young to appreciate the historical importance and ramifications of the events that took place back then. The impact of higher interest rates had a massive positive impact on corralling the growth of both credit and debt acting as a crucial reset to the economy for decades to come. Below is a copy of that article.
A Time For Action, 1980?
In his book “A Time For Action” written in 1980 William Simon, a former Secretary of the Treasury tells how he was “frightened and angry”. In short, he sounded the trumpet about how he saw the country was heading down the wrong path. William Simon (1927 – 2000) was a businessman and a philanthropist. He became the Secretary of the Treasury on May 8, 1974, during the Nixon administration and was reappointed by President Ford and served until 1977.
I recently picked up a copy of the book that I had read decades ago and while re-reading it I reflected on and tried to evaluate the events that brought us to today. As often the future is unpredictable, looking back, it is hard to imagine how we have made it this long without finding long-term solutions and addressing the concerns that Simon wrote about so many years ago. Back then it was about billions of dollars of debt, today it is about trillions of dollars. It appears that something has gone very wrong.
Do Not Underestimate The Importance Of The Reset By Paul Volcker In 1980
By the end of the 70s inflation started to soar. Only by taking interest rates to nosebleed levels was then Fed Chairman Paul Volcker able to bring inflation back under control. Paul Volcker, a Democrat was appointed as Federal Reserve chairmanby President Carter and reappointed by President Reagan. Volcker is widely credited with ending the stagflation crisis where inflation peaked at 13.5% in 1981. He did this by raising the fed fund rate which averaged 11.2% in 1979 to 20% in June of 1981. This caused the prime rate to hit 21.5% and slammed the economy into a brick wall. This also affected and shaped the level of interest rates for decades
Rates Today Are Ready To Fall Off The Chart!
This action and the increased interest rates in following years is credited by many to have caused Congress and the President to eventually balance the budget and bring back some sense of fiscal integrity and price stability to America. As the debt from the Vietnam war and soaring oil prices became institutionalized we moved on. Interest rates slowly dropped and the budget came under control. In recent years spending has again started to grow and at the same time taxes have been cut. This has slowly occurred over years and been ingrained in the system.
With our debt at 23 trillion and growing the path has again become unsustainable and many people will be shocked when the reality hits. As our debt climbs some Americans feel just as frightened and angry as Simon did so many years ago. America has kicked the can down the road, failing time and time again to face the tough decisions. Part of the problem is the amount of debt has grown so large that we can no longer imagine or put a face on it. The day of reckoning may soon be upon us, how it arrives is the question. Many of us see it coming, but the one thing we can bank on is that when it arrives many will be caught totally off guard.
Having warned in the past that central banks’ ability to reverse an economic downturn is coming to an end (just as the global economy enters what he says are the late stages of the long-term debt cycle), Billionaire hedge-fund founder Ray Dalio warned today that the global economy is under threat from an explosive mix of ineffective monetary policy, a rise in the wealth gap and climate change.
This combination, according to the Bridgewater Associates founder – the world’s largest hedge fund – will lead to a “scary situation” over the next decade…
“The technology and increasing use of artificial intelligence and increased productivity will also substantially increase the wealth gap, the job gap, the wealth and ideological conflicts within countries.”
This brief comment fits with Dalio’s previous warning that there are “three big forces” for investors to watch: the point where there’s an economic downturn and central banks can’t cut interest rates further and their asset purchases cease being effective, when rising inequality sparks “extreme” conflicts between the rich and poor, and the battle for global dominion between the rising power of China and the incumbent world power, the US. Concluding that if/when there is an economic downturn, that will produce serious problems in ways that are analogous to the ways that the confluence of those three influences produced serious problems in the late 1930s. Regarding the above analog and where we are now, in my opinion, the most important things that are happening (which last happened in the late 1930s) are a) we are approaching the ends of both the short-term and long-term debt cycles in the world’s three major reserve currencies, while b) the debt and non-debt obligations (e.g. healthcare and pensions) that are coming at us are larger than the incomes that are required to fund them, c) large wealth and political gaps are producing political conflicts within countries that are characterized by larger and more extreme levels of internal conflicts between the rich and the poor and between capitalists and socialists, d) external politics is driven by the rising of an emerging power (China) to challenge the existing world power (the US), which is leading to a more extreme external conflict and will eventually lead to a change in the world order, and [Ian Bremmer calls this the return of a bi-polar world but with significant differences in the goals of the powers—JM] e) the excess expected returns of bonds is compressing relative to the returns on the cash rates central banks are providing As for monetary policy and fiscal policy responses, it seems to me that we are classically in the late stages of the long-term debt cycle when central banks’ power to ease in order to reverse an economic downturn is coming to an end because: Monetary Policy 1 (i.e. the ability to lower interest rates) doesn’t work effectively because interest rates get so low that lowering them enough to stimulate growth doesn’t work well, Monetary Policy 2 (i.e. printing money and buying financial assets) doesn’t work well because that doesn’t produce adequate credit in the real economy (as distinct from credit growth to leverage up investment assets), so there is “pushing on a string.” That creates the need for… Monetary Policy 3 (large budget deficits and monetizing of them) which is problematic especially in this highly politicized and undisciplined environment. More specifically, central bank policies will push short-term and long-term real and nominal interest rates very low and print money to buy financial assets because they will need to set short-term interest rates as low as possible due to the large debt and other obligations (e.g. pensions and healthcare obligations) that are coming due and because of weakness in the economy and low inflation. Their hope will be that doing so will drive the expected returns of cash below the expected returns of bonds, but that won’t work well because: a) these rates are too close to their floors, b) there is a weakening in growth and inflation expectations which is also lowering the expected returns of equities, c) real rates need to go very low because of the large debt and other obligations coming due, and d) the purchases of financial assets by central banks stays in the hands of investors rather than trickles down to most of the economy (which worsens the wealth gap and the populist political responses). This has happened at a time when investors have become increasingly leveraged long due to the low interest rates and their increased liquidity. As a result we see the market driving down short-term rates while central banks are also turning more toward long-term interest rate and yield curve controls, just as they did from the late 1930s through most of the 1940s.
With the Federal Reserve rate cut already priced in for next week, what will actually happen to the gold price once the central bank cuts for the third time this year?
Analysts sounded positive as gold’s new technical momentum took prices temporarily to $1,520 an ounce, hitting a two-week high. Since then, prices retreated, but not below the key psychological $1,500 an ounce level.
“You have demand now from momentum traders. We have options expirations on Monday on the Comex. I talk about the fact that price makes the news. Prices got the attention of global traders. We are going to lose a lot of open interest from short-covering,” RBC Wealth Management managing director George Gero told Kitco News on Friday.
Chart-based buying was giving prices a boost, Kitco’s senior technical analyst Jim Wyckoff pointed out. “Both gold and silver have seen their near-term technical postures improve markedly this week–near-term price downtrends on the daily charts were negated, which is inviting chart-based buyers into the markets,” Wyckoff said.
Also, weaker economic data has helped gold move above $1,500 an ounce as traders were starting to price in more cuts as they worried about slower economic growth.
“We bounced off $1,480 level, which has been a bit the support recently. We continue to see weaker economic data from the U.S. in particular and that has helped strengthen the case for a cut next week,” said TD Securities commodity strategist Ryan McKay.
Blue Line Futures president Bill Baruch described Friday’s move up as very technical in nature.
“The market could not go lower. The profile was exhausted to the downside and the bears could not do anything. We are seeing moves above technical levels that are gathering additional tailwinds,” Baruch said. “I’ve been upbeat on longer-term gold. Earlier this week, we’ve gone bullish in the near-term as well.”
It is advisable to get a bit more defensive in your portfolio, said RJO Futures senior market strategist Phillip Streible.
“Fresh weak economic data is really increasing expectations that the Fed is going to do that cut next week. Weaker durable goods versus expectations for the second month in a row got traders scratching their heads about the health of the economy,” Streible said. “We also saw weaker data come out of tech stocks, which is a big growth sector. Those kinds of concerns really got people slightly worried.”
Now, many are eyeing the $1,525 level as the key resistance that the yellow metal needs to break to move significantly higher.
“Gold has to get above $1,525 and then we can clear the way. If we can close the month anywhere near $1,550, those expectations of the $1,600 year-end target actually have a chance,” Streible said.
The Fed might disappoint with a more hawkish tone
The Federal Reserve announcement on Wednesday is the key event to watch next week, according to analysts, who are cautious that the market might be expecting an unrealistically dovish tone from the central bank’s Chair Jerome Powell.
“In the last couple days — the hawkish Pence speech and the weaker U.S. data — markets are getting more convinced that Powell will strike a dovish tone at the next meeting,” said McKay. “But, this might be a little premature. We are skeptical that Powell is going to signal more cuts after a cut next week. The Fed is likely to put rate cuts on pause for at least near-term to assess the impact of the potential three cuts they do this year.”
Lack of dovishness from Powell could weigh on gold next week as markets are disappointed, McKay added.
Also, the Fed’s rate cut has largely been priced in by the gold market, which means any hawkish hints could push gold lower, Baruch pointed out.
“What matters is the narrative they speak of and how they plan on moving forward. So it’s not so much the cut but future cuts. Will they be as dovish as the markets are anticipating?” he Baruch. “Also, don’t underestimate Brexit and the U.S.-China talks.”
At the time of writing, the markets were estimating a 93.5% chance of a 25-basis-point cut, according to the CME FedWatch Tool.
Data to watch next week
Some key macro releases next week include Friday’s U.S. employment report, which is estimated to show that an additional 90,000 jobs have been created in October.
Another important dataset will be the preliminary Q3 GDP figure on Wednesday, which is projected to come in at 1.7%.
Other items to keep a close eye on are CB consumer confidence report and U.S. pending home sales on Tuesday, as well as, personal spending on Thursday and ISM manufacturing PMI on Friday.By Anna Golubova


